MathIndustry 2020
An Economic Stimulus Opportunity for Canada
Explore projects and reports from the 2020 edition of M2PI
Final Report
MathIndustry Editions
Explore the projects and reports from previous editions
MathIndustry 2025
MathIndustry 2024
MathIndustry 2023
MathIndustry 2022
Math to Power Industry 2022 (M2PI 2022) will take place July 11-29, 2022. We are now inviting non-academic partner organizations to consider particpation in this workshop.
- Organizations are invited to submit math challenges for teams of graduate students and postdoctorol fellows to tackle during the workshop
- PIMS matches your company to an academic researcher who can provide support for developing the problem statement.
- Companies provide an industry mentor to work closely with the team during the workshop for a minimum of two hours per day during the last 10 days of the workshop. Industry mentors are welcome to work more closely with the team if desired.
- During the workshop our graduate student and postdoc participants will also receive professional and technical skills training relevant to STEM careers in industry.
- Efforts will be made to link companies to talent during and beyond the workshop to explore internships and other hiring needs.
MathIndustry 2021
The final-report for m2pi 2021 is now available. It features projects from
- Aerium Analytics
- ATCO
- CSTS Healthcare
- City of Winnipeg - Insect Control Branch
- IOTO International
- McMillan-McGee
- Natural Resources Canada
- Serious Labs
- TheoryMesh
MathIndustry 2020
Projects, reports, team members and other details are available on the MathIndustry 2020 page. .
- Aerium Analytics Inc.
- ATCO Ltd.
- BC Financial Services Authority
- Cenovus Energy Inc.
- The Divi Project
- Environmental Instruments Canada Inc.
- Fotech Solutions
- IOTO International Inc.
- McMillan-McGee Corporation
- Ovintiv Inc.
Skills
Certified training programs
Agile software development, virtual collaboration, open source toolchains
communication skills, project management, effective teams & ethics
Projects
This project aims to create new tools to extract insights with predictive or decision making value from the output of legislative bodies. It will investigate whether techniques from signal analysis or related mathematical fields can be used to help construct these tools. The goal is to leverage public data from legislative bodies to reveal what in the legislative activity is deserving if attention from a policy point of view, either by connecting with a known policy ontology (such as the comparative agendas codebook), or by surfacing issues that should be connected to a known ontology.
This project will track and evaluate parliamentary members and their involvement and activities on environment protection and sustainable development. It will leverage public data with tools such as sentiment analysis to draw conclusions on these topics. The evaluation will focused on data from 2021 (or 2022, depending on availability) and we will start by looking at the activities of the members of Standing Committee on Environment and Sustainable Development.
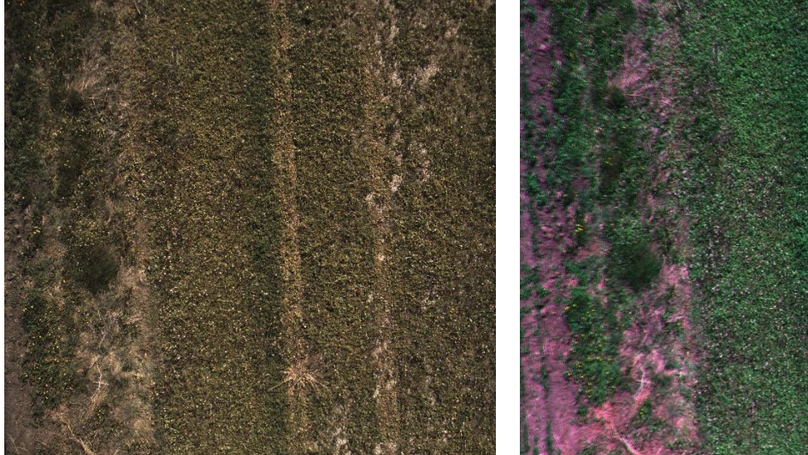
The ability to detect man-made objects in vegetation would aid many fields of industry including – but not limited to – search and rescue as well as agriculture. The ability to locate man-made objects such as damaged modes of transportation, camping or hiking equipment, parachutes, etc. in said vegetation aids the chances of locating missing individuals involved in these cases. While much imagery of these objects exists, imagery of them in varying degrees of repair within vegetation is limited at best making standard machine learning detection methods difficult. In such cases, focusing on the vegetation may enable the detection of such objects through machine learning methods where imagery is limited. In agriculture, farming equipment may require repair while in the field where it is easily possible to misplace equipment in vegetation. This lost equipment could damage other farming equipment while work is being done. Locating lost equipment will help limit further damage of farming equipment saving not only money, but time and production as well.
For this project, the team will be given access to aerial multispectral imagery containing a variety of man-made objects located in vegetation. The goal of this project is to develop a method which can detect these random man-made objects using machine learning and computer vision techniques while investigating the benefits of multispectral data to solving this problem. The machine learning field of focus for this problem is that of anomaly detection.
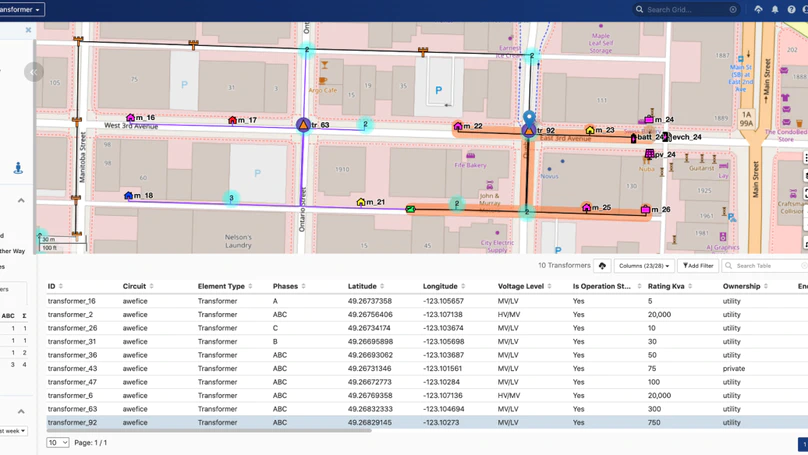
At Awesense we’ve been building a platform for digital energy, with the goal of allowing easy access to and use of electrical grid data in order to build a myriad of applications and use cases for the decarbonized grid of the future, which will need to include more and more distributed energy resources (DERs) such as rooftop solar, batteries as well as electric vehicles (EVs).
Awesense has built a sandbox environment populated with synthetic but realistic data and exposing APIs on top of which such applications can be built. As such, what we are looking for is to create a collection of prototype applications demonstrating the power of the platform. Given the synthetic nature of the dataset we can make available, this would be more of a “deliver a method (and implementation of it)” type project than a “deliver insights” type project.
This involves coding some analyses and visualizations on top of said data and APIs. It would require good data wrangling + statistics + data visualization skills to design and then implement the best way to transform, aggregate and visualize the data for the use case at hand (see below). The data access APIs are in SQL form, so SQL querying skills would also be required. Beyond that, the tools and programming languages used to create the analyses and visualizations would be up to the students. Typical ones we have used include BI tools like Power BI or Tableau and notebooking applications like Jupyter or Zeppelin combined with programming languages like python or R.
If the participants don’t have any electrical background, we can teach enough of it to allow handling the given use case. For this year’s project, we have chosen a use case entitled “EV charger capacity study”. At a high level, this entails determining how many new EV chargers could be installed in a particular portion of the electrical distribution grid without overloading the capacity of the grid infrastructure at that location. This would allow distribution grid planners to determine whether or not to approve requests for “interconnection” of EV chargers; it would also allow them to plan for needed infrastructure upgrades to support more EV chargers in the future.
Local labour market information (LMI), including employment, unemployment, and participation rates, are important for planning activities conducted by municipal and First Nation governments, service providers, and many more organizations. Census of Population (Census) data, published by Statistics Canada (StatCan), provides LMI at the Census Division (CD) and Census Subdivision (CSD) levels. However, the Census is only conducted every five years. This project asks participants to build a model which estimates intercensal LMI at the CD and CSD levels.
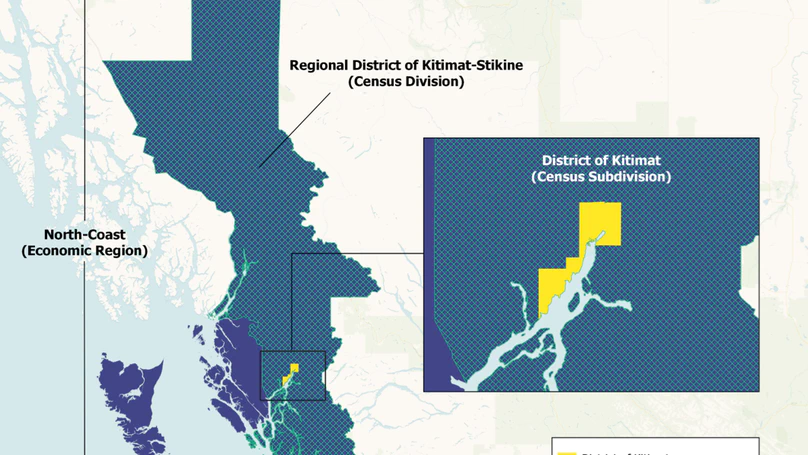
LMI are not publicly available at the CD and CSD levels of geography for years when the Census is not conducted. StatCan’s Labour Force Survey provides data on a monthly basis. However, StatCan does not publish Labour Force Survey data at the CD or CSD levels. As such, LMI at the Economic Region level are often used in the place of intercensal data on CDs or CSDs. Figure 1 shows the CSD of the District of Kitimat, as well as the larger CD and Economic Region it is within, as an example illustrating how Economic Regions may not serve as good proxies for CSDs.
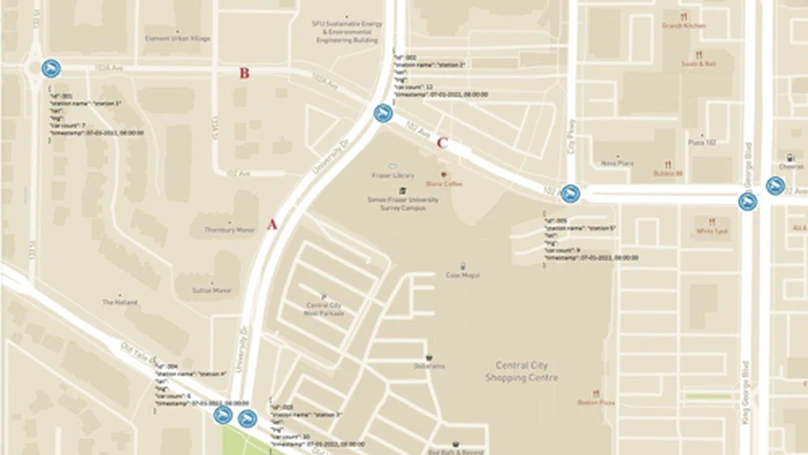
Cedar Academy Society is building a digital representation or “digital twin” of a Lower Mainland city, powered by Unity3D engine. During the summer of 2022, we aim to complete the integration of real-time traffic data into such model to better reflect the dynamic nature of the communities we live in. Through previous studies, we have been able to associate traffic camera-captured images to object counts. This year, we intend to drive further and to project those object counts into visualized traffic in a virtual world.
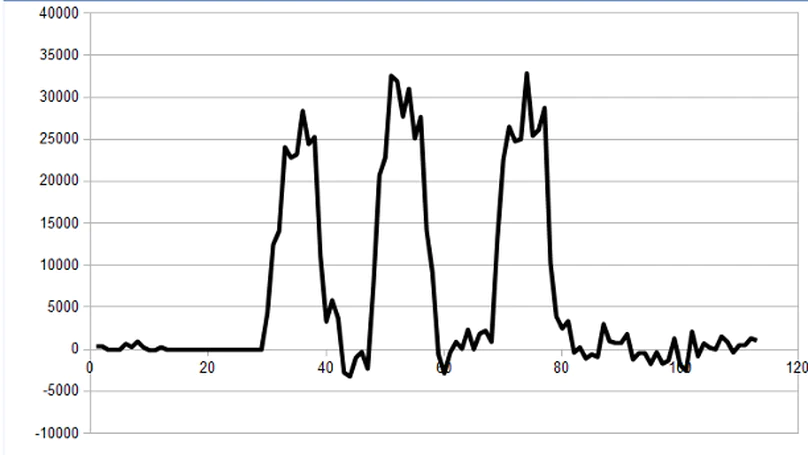
Residential radon progeny exposure is the second leading cause of lung cancer, after smoking. The two main radon isotopes are Rn-222, which is part of the uranium-238 decay chain, and Rn-220, also called thoron, which is part of the thorium-232 decay chain. There is currently much interest in the Rn-220 contribution to radon progeny exposure, which has so far been largely ignored. (Rn-220 has a relatively short half life and usually decays before it reaches the living areas in a house and it usually doesn’t show up in radon measurements. But, Rn-220 has a longer lived decay product which does reach living areas and contributes to radon progeny exposure. It can even exceed the Rn-222 contribution.)
Environmental Instruments Canada (EIC) produces a Radon Sniffer (see https://radonsniffer.com/ ), which is used by radon mitigators and building scientists to find radon entry points. These sniffers currently assume all radon is Rn-222. See the appendix for a more detailed description of how the sniffer works. We want to extend the functionality to Rn-220.
In a 2020 M2PI project, we came up with a dedicated sampling and counting sequence and developed the math to determine how much Rn-222 vs Rn-220 was in the air. This report is available to the team.
In this project, we wish to develop a method by which we can determine the presence of Rn-220 in the air, while the Radon Sniffer is continually sampling air and without having to run a dedicated thoron measurement sequence.
Principal Component Analysis (PCA), as well as Factor Analysis, are a couple of techniques used to increase data value by making data more interpretable while simultaneously preserving as much variability and information possible . Given large topic-indexed datasets reflecting activity by parliamentarians such as chamber interventions, committee interventions, bills, motions, and chamber votes how might such analytical techniques be used to reduce the dimensionality of these sets while increasing their interpretability? Can useful and efficient graphical displays for the public be generated through the application of such techniques to political data? What other types of data analysis methods may be used alongside such techniques to extract meaning from political data? What measures of similitude or difference between individual politicians or parties might be derived? How might such features help to measure political performance? How can topic indexes be aggregated to reflect similarities in political concern?
Background
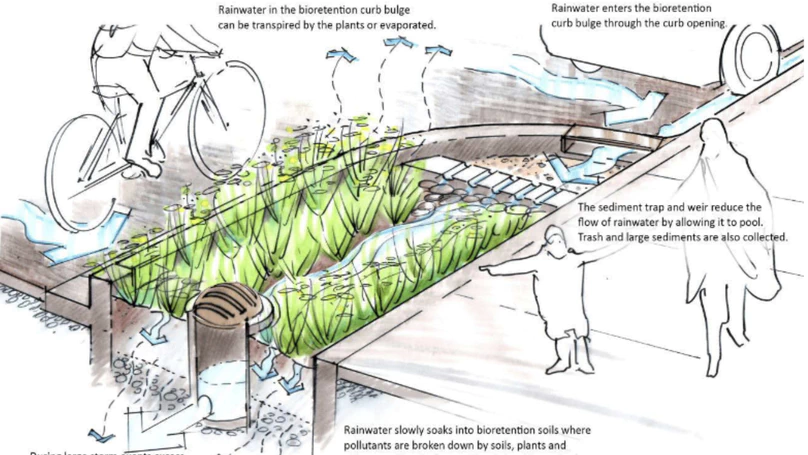
The stormwater infrastructure in many cities is facing challenges as the climate changes, rainfall patterns change and sea levels rise. To meet these challenges, cities are installing green infrastructure (GI) systems to absorb and retain rainfall where it lands and reduce sewer overflow. Across North America alone, cities are investing over $56.2 billion dollars in green infrastructure. By doing so, communities are becoming more resilient against climate change and are achieving environmental, social and economic benefits. Novion’s Climate Intelligence Platform helps cities monitor their green infrastructure for performance optimization, regulatory compliance, and maintenance.
Problem Statement
Once green infrastructure has been constructed, monitoring the changes in water level after a rainfall event is required to verify its performance and net impact. This project will investigate aspects of this monitoring.
Performance metrics in sports have seen remarkable growth and development. What if we turned some of these mathematical tools on political performance? Building on last year’s M2PI project, the goal of this year’s project is to analyze data related to the activities of legislators in Canada and the USA with a view to developing engineered features which might reflect political performance. These engineered features should be granular enough to significantly inflect during the course of a parliamentary or legislative session, providing quantitative and comparative performance insight.
The City of Winnipeg’s Insect Control Branch (ICB) of the Public Works Department provides services to Winnipeg residents to control insects, including mosquitoes. The mosquito control program is based on an environmentally mindful insect control strategy, and includes: (1) A larviciding program that is 100% biological and uses four larviciding helicopters, (2) Monitoring and treating over 31,500 hectares of water area on an ongoing basis based on weather conditions, and (3) Monitoring for adult nuisance mosquitoes in New Jersey Light Traps beginning early May.
In this project, we will examine some of the key challenges facing the ICB such as (1) Predictive modelling of adult mosquito populations subject to changes in rainfall/soil moisture content and wind speed (2) Preditictive modelling of larval development subject to changes in spring and summer temperatures.
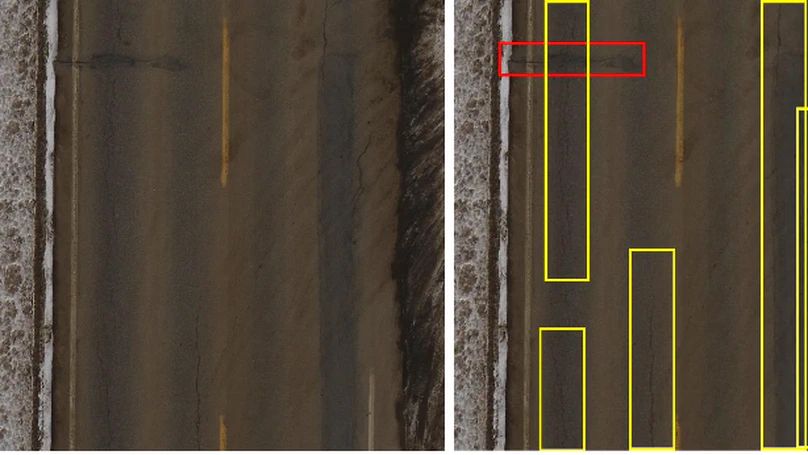
Roads are a vital component of today’s society. They not only connect us to different cities, towns, provinces, and countries, but they also provide of a means of transporting goods and services. Typically, roads are constructed using materials such as concrete, or asphalt. Between the cold winter temperatures and hot summer temperatures, as well as settling earth, cracks and potholes are bound to occur on roads.
Alberta spent over 1.6 billion dollars in transportation related needs in 2020-21. Over 26% of this money went towards road construction and maintenance related expenditures. Roads undergo regular inspection; a detailed Surface Condition Rating occurs every two years in Alberta. This helps determine the priority in which maintenance should occur on roads in the province. One method of conducting these inspections could be done via aerial imagery. While an individual could go through these images to inspect the roads for cracks and potholes, is there a way that machine learning and computer vision could not only detect cracks but also classify their severity?
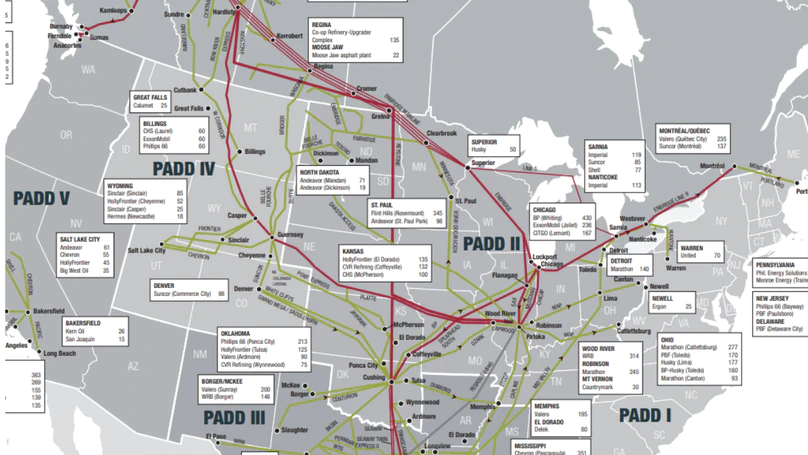
This project concerns the transportation of heavy oil via pipeline, and the impact of congestion in transportation on pricing. Using stochastic transport optimization can we model and answer the following questions: When there are documented disruptions in the transport system, can we predict how large the congestion surcharge was and how prices responded to the disruption? Can we predict the occurrence of congestion by perturbing input factors in the system? How do shape and connections in the transport network contribute to the propensity for frequency of the congestion and magnitude of congestion surcharge?
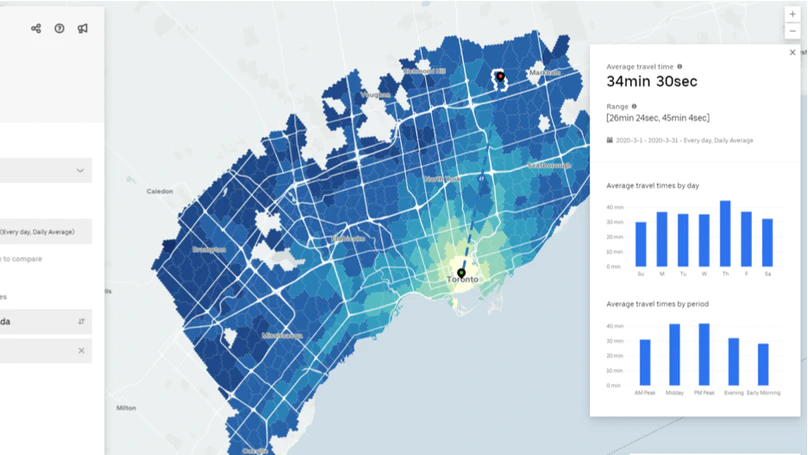
Due to the outbreak of Covid-19 around the world, and government policies implemented as a response to the outbreak, many corporations have chosen to let their employees work from home to prevent the spread of the disease. In order to safely re-open the economy, one of the recommendations from health authorities is to allow only a limited percentage of workers in the workplace at any specific time. Given these constraints, it is useful for companies to arrange flexible work schedule so the employees go to offices during reasonable working hours, and at the same time reduce their commute time to improve their productivity. In this problem, you will help a model business to design and optimize their employees’ working-at-office schedule using a combination of criteria which you deem to be important, and real-life data such as traffic, limitation on work schedule hours, commuting time and others.
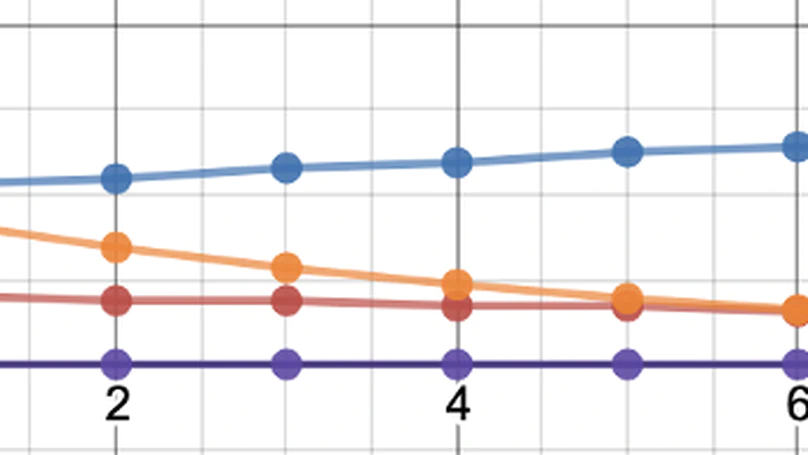
Environmental Instruments Canada (EIC) produces a Radon Sniffer which is used to find radon entry points. One method of determining the ratio of Radon 222 to Radon 220 (thoron) in the air is by implementing sampling and counting sequences and observing the change in the alpha count over time. The goal of this project is to develop an optimized sampling and counting sequence that results in the best statistical accuracy. Understanding radioactive decay and the coupled differential equations describing a decay series would be useful. A team with statistical expertise would be essential. Some familiarity with spreadsheets such as Excel would be helpful.
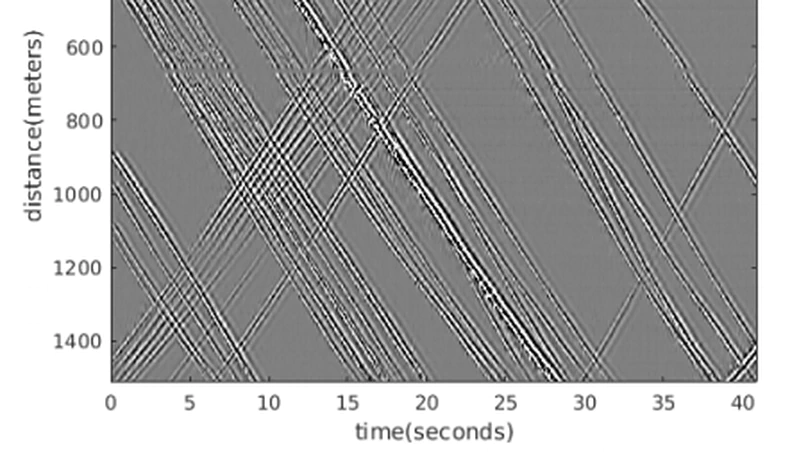
Consider a distributed acoustic sensing (DAS) system monitoring a fibre optic cable deployed along an active roadway. The goal of this project is to use data collected from the DAS system to develop a detection and tracking method capable of identifying individual vehicles and reporting their position and velocity as they move along the road/fibre. Once the position and velocity are determined, various metrics for traffic flow could be determined, allowing for prediction and optimization of traffic congestion.
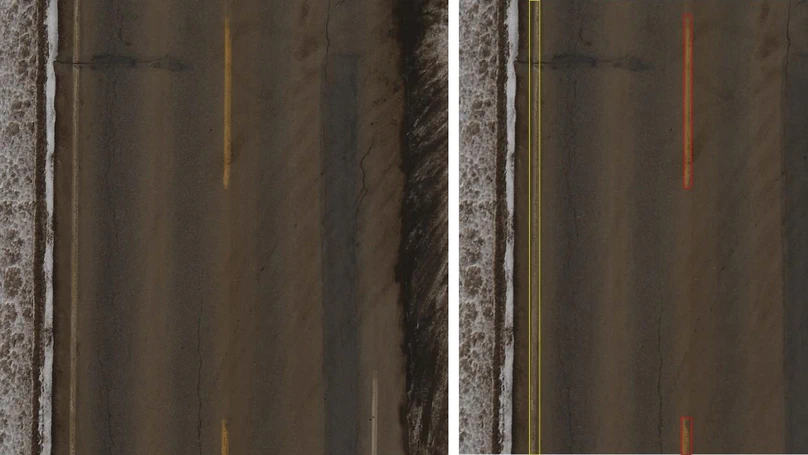
Standard procedure for building training sets for some machine learning models involves an individual going through hundreds of images and creating 2D binary matrices which reflects where the region of interest is in each image. Depending on the type of images, can we use RGB information or some other method to automate this process? The goal of this project is to develop a method which creates a mask of an image depicting where monochromatic objects occur in an image automatically and with limited user input.
