MathIndustry 2021
August 3-27, 2021
In August 2021 PIMS held a virtual workshop called Math to power Industry (M@PI 2021) for graduate students and postdoctoral fellows in the mathematical and statistical sciences to gain the industry skills necessary for success in their careers.
This workshop had two main objectives:
- To build technical skills in programming and computational workflows
- To build business skills for effective teamwork and technical report writing
Attendees gained hands-on experience as part of a team working on a real-world problem posed by an industry partner.
Final Report
Meet the Teams
Adeyemi Fagbade
Team 2 - ATCO
Aidin Zaherparandaz
Team 4 - City of Winnipeg ICB
Alexandra McSween
Team 2 - ATCO
Amit jha
Team 1 - Aerium Analytics
Aniket Joshi
Team 5 - IOTO
Arian Khorasani
Team 6 - McMillan McGee
Arnaud Ngopnang
Team 9 - Serious Labs
Avleen Kaur
Team 1 - Aerium Analytics
Bahar Mousazadeh
Team 9 - Serious Labs
Bryan Kettle
Team 7 - NRCAN 1
Carson Chambers
Team 6 - McMillian McGee
Edgar Pacheco Castan
Team 10 - TheoryMesh
Ellie Thieu
Team 3 - CSTS Healthcare
Eric Rozon
Team 3 - CSTS Healthcare
Guojun Ma
Team 5 - IOTO
Hamid Hamidi
Team 1 - Aerium Analytics
Igor Pinheiro
Team 10 - TheoryMesh
Joel Benesh
Team 8 - NRCAN 2
Jules Hoepner
Team 8 - NRCAN 2
Mahsa N. Shirazi
Team 2 - ATCO
Maksym Neyra-Nesterenko
Team 9 - Serious Labs
Mishty Ray
Team 8 - NRCAN 2
Mitch Haslehurst
Team 5 - IOTO International
Moumita Shau
Team 9 - Serious Labs
Natalia Accomazzo Scotti
IOTO Project Member
Nimanthi Yaseema
Clause Technology Project Member
Noah Bolohan
Team 7 - NRCAN 1
Parham Hamidi
Team 1 - Aerium Analytics
Pedro Jose Sobrevilla Moreno
Team 6 - McMillan-McGee
Rachel Han
Team 8 - NRCAN 2
Saimon Yeal Islam
Team 10 - TheoryMesh
Sam Simon
Team 5 - IOTO
Shen-Ning Tung
Team 5 - IOTO
Thomas Pender
Team 10 - TheoryMesh
Xiaowei Li
Team 1 - Aerium Analytics
Adam Kashlak
Academic Mentor
Adam Preuss
Mentor
Ali Hashemi
Mentor
Andrii Arman
Academic Mentor
Aysa Fakheri Tabrizi
Academic Mentor
Chris Bunio
Mentor
Cüneyt Gürcan Akçora
Mentor
Devin Goodsman
Mentor
Edwin Reid
Mentor
Heather Vooys
Mentor
Hui Huang
Academic Mentor
Jennifer Bodnarchuk
Mentor
Jonathan Gallagher
Mentor
Joshua Brinkerhoff
Academic Mentor
Julien Arino
Academic Mentor
Ken Nawolsky
Mentor
Nisha Mohan
Mentor
Peijun Sang
Academic Mentor
Slim Ibrahim
Academic Mentor
Vakhtang Putkaradze
Mentor
William Spat
Mentor
Matthew Greenberg
SKLearn (Python) Instructor
Alex Razoumov
Parallel Coding with Chapel Instructor
Jolen Galaugher
How to pitch a Solution Instructor
Laura Gutierrez Funderburk
Ethics in AI Instructor
Lorena Solis
Ethics, Diversity and Inclusion Instructor
Marie-Hélène Burle
Git and GitHub instructor
Rob Baecker
Entrepreneurship Instructor
Samantha Jones
Equity, Diversity and Inclusion Instructor
Tom O'Neill
Effective Teams Instructor
MathIndustry Editions
Explore the projects and reports from previous editions of MathIndustry
MathIndustry 2021
The final-report for m2pi 2021 is now available. It features projects from
- Aerium Analytics
- ATCO
- CSTS Healthcare
- City of Winnipeg - Insect Control Branch
- IOTO International
- McMillan-McGee
- Natural Resources Canada
- Serious Labs
- TheoryMesh
MathIndustry 2020
Projects, reports, team members and other details are available on the MathIndustry 2020 page. .
- Aerium Analytics Inc.
- ATCO Ltd.
- BC Financial Services Authority
- Cenovus Energy Inc.
- The Divi Project
- Environmental Instruments Canada Inc.
- Fotech Solutions
- IOTO International Inc.
- McMillan-McGee Corporation
- Ovintiv Inc.
Skills
Certified training programs
Agile software development, virtual collaboration, open source toolchains
communication skills, project management, effective teams & ethics
Projects
Projects
.js-id-2021This project aims to create new tools to extract insights with predictive or decision making value from the output of legislative bodies. It will investigate whether techniques from signal analysis or related mathematical fields can be used to help construct these tools. The goal is to leverage public data from legislative bodies to reveal what in the legislative activity is deserving of attention from a policy point of view, either by connecting with a known policy ontology (such as the comparative agendas codebook), or by surfacing issues that should be connected to a known ontology.
This project will track and evaluate parliamentary members and their involvement and activities on environment protection and sustainable development. It will leverage public data with tools such as sentiment analysis to draw conclusions on these topics. The evaluation will focused on data from 2021 (or 2022, depending on availability) and we will start by looking at the activities of the members of Standing Committee on Environment and Sustainable Development.
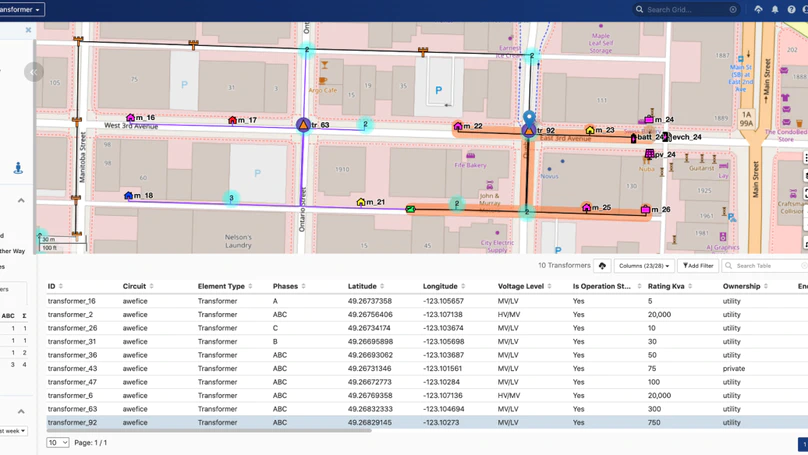
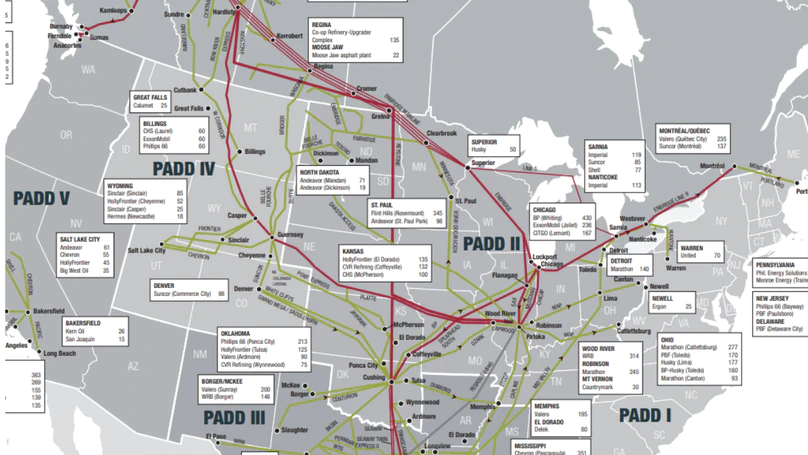
At Awesense we’ve been building a platform for digital energy, with the goal of allowing easy access to and use of electrical grid data in order to build a myriad of applications and use cases for the decarbonized grid of the future, which will need to include more and more distributed energy resources (DERs) such as rooftop solar, batteries as well as electric vehicles (EVs).
Awesense has built a sandbox environment populated with synthetic but realistic data and exposing APIs on top of which such applications can be built. As such, what we are looking for is to create a collection of prototype applications demonstrating the power of the platform. Given the synthetic nature of the dataset we can make available, this would be more of a “deliver a method (and implementation of it)” type project than a “deliver insights” type project.
This involves coding some analyses and visualizations on top of said data and APIs. It would require good data wrangling + statistics + data visualization skills to design and then implement the best way to transform, aggregate and visualize the data for the use case at hand (see below). The data access APIs are in SQL form, so SQL querying skills would also be required. Beyond that, the tools and programming languages used to create the analyses and visualizations would be up to the students. Typical ones we have used include BI tools like Power BI or Tableau and notebooking applications like Jupyter or Zeppelin combined with programming languages like python or R.
If the participants don’t have any electrical background, we can teach enough of it to allow handling the given use case. For this year’s project, we have chosen a use case entitled “EV charger capacity study”. At a high level, this entails determining how many new EV chargers could be installed in a particular portion of the electrical distribution grid without overloading the capacity of the grid infrastructure at that location. This would allow distribution grid planners to determine whether or not to approve requests for “interconnection” of EV chargers; it would also allow them to plan for needed infrastructure upgrades to support more EV chargers in the future.

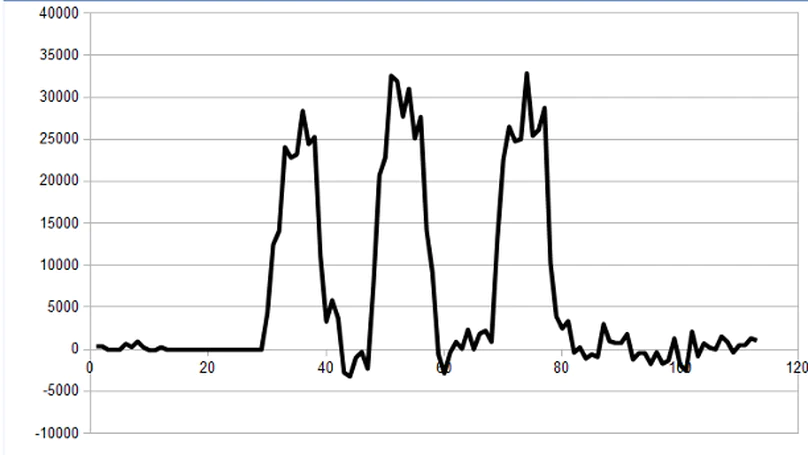
Residential radon progeny exposure is the second leading cause of lung cancer, after smoking. The two main radon isotopes are Rn-222, which is part of the uranium-238 decay chain, and Rn-220, also called thoron, which is part of the thorium-232 decay chain. There is currently much interest in the Rn-220 contribution to radon progeny exposure, which has so far been largely ignored. (Rn-220 has a relatively short half life and usually decays before it reaches the living areas in a house and it usually doesn’t show up in radon measurements. But, Rn-220 has a longer lived decay product which does reach living areas and contributes to radon progeny exposure. It can even exceed the Rn-222 contribution.)
Environmental Instruments Canada (EIC) produces a Radon Sniffer (see https://radonsniffer.com/ ), which is used by radon mitigators and building scientists to find radon entry points. These sniffers currently assume all radon is Rn-222. See the appendix for a more detailed description of how the sniffer works. We want to extend the functionality to Rn-220.
In a 2020 M2PI project, we came up with a dedicated sampling and counting sequence and developed the math to determine how much Rn-222 vs Rn-220 was in the air. This report is available to the team.
In this project, we wish to develop a method by which we can determine the presence of Rn-220 in the air, while the Radon Sniffer is continually sampling air and without having to run a dedicated thoron measurement sequence.
Principal Component Analysis (PCA), as well as Factor Analysis, are a couple of techniques used to increase data value by making data more interpretable while simultaneously preserving as much variability and information possible . Given large topic-indexed datasets reflecting activity by parliamentarians such as chamber interventions, committee interventions, bills, motions, and chamber votes how might such analytical techniques be used to reduce the dimensionality of these sets while increasing their interpretability? Can useful and efficient graphical displays for the public be generated through the application of such techniques to political data? What other types of data analysis methods may be used alongside such techniques to extract meaning from political data? What measures of similitude or difference between individual politicians or parties might be derived? How might such features help to measure political performance? How can topic indexes be aggregated to reflect similarities in political concern?
Performance metrics in sports have seen remarkable growth and development. What if we turned some of these mathematical tools on political performance? Building on last year’s M2PI project, the goal of this year’s project is to analyze data related to the activities of legislators in Canada and the USA with a view to developing engineered features which might reflect political performance. These engineered features should be granular enough to significantly inflect during the course of a parliamentary or legislative session, providing quantitative and comparative performance insight.
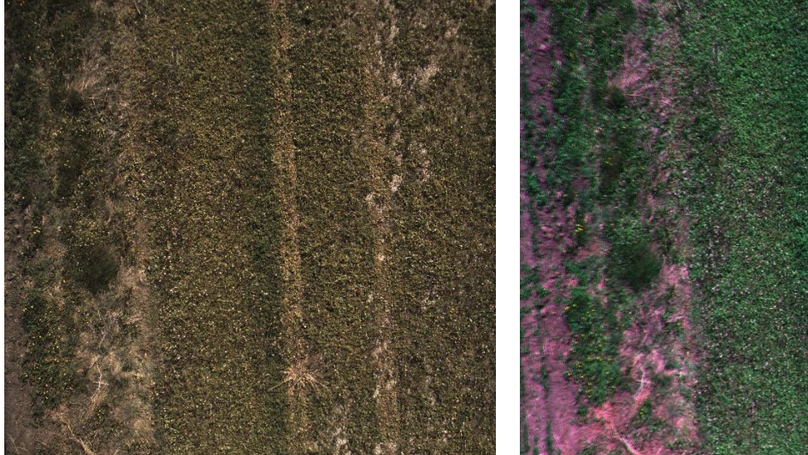
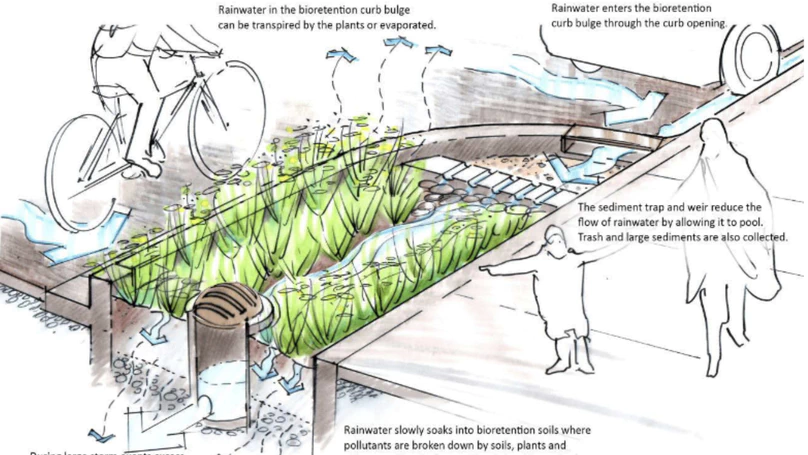
The City of Winnipeg’s Insect Control Branch (ICB) of the Public Works Department provides services to Winnipeg residents to control insects, including mosquitoes. The mosquito control program is based on an environmentally mindful insect control strategy, and includes: (1) A larviciding program that is 100% biological and uses four larviciding helicopters, (2) Monitoring and treating over 31,500 hectares of water area on an ongoing basis based on weather conditions, and (3) Monitoring for adult nuisance mosquitoes in New Jersey Light Traps beginning early May.
In this project, we will examine some of the key challenges facing the ICB such as (1) Predictive modelling of adult mosquito populations subject to changes in rainfall/soil moisture content and wind speed (2) Preditictive modelling of larval development subject to changes in spring and summer temperatures.


Partners