Cenovus Energy
Modelling Canadian Heavy Crude Congestion pricing using Capacitated Transport networks
Problem Proposal:
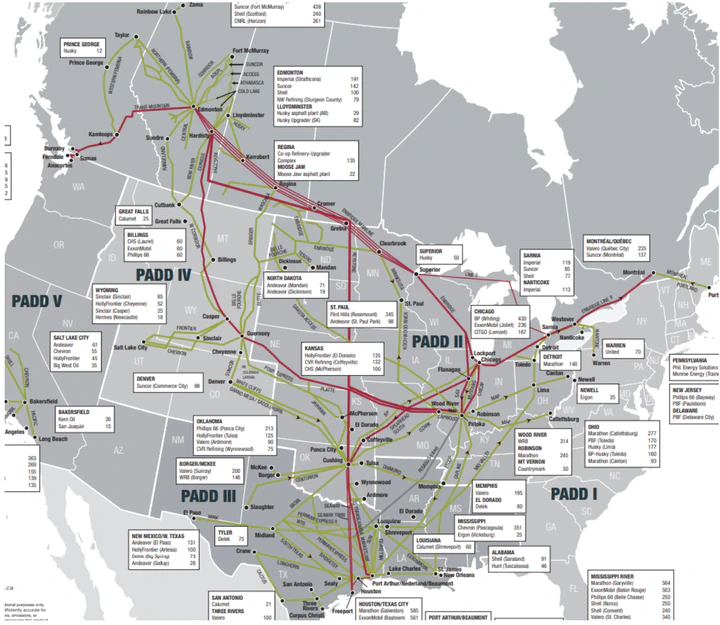
Alberta produces ~4MM bbls/d of crude oil of which ~3 MMbbls/d is considered “heavy oil”. Majority or 2/3 of Canadian heavy oil is consumed in PADD II and 1/3 in USGC refining center. The PADD III or USGC is considered a marginal consumption point for Canadian crude where the “last barrel” or marginal barrel is being consumed. Canadian crude can reach USGC through number of pipe options: Enbridge mainline, Express, and Keystone, or rail from either Edmonton or Hardisty. The cost of transport of the last barrel from Alberta to USGC is going to set the price of Canadian heavy benchmark (WCS) in Alberta.
Pipe is considered a cheapest mode of transport of Canadian crude to the demand markets. The total offtake capacity from Alberta is on average less than the total available production. This leads often to the requirement of “call on rail” or shut-ins to balance the market which in turn leads to significant price response.
Prices are generally integrated if they respond to same price shock. In reality looking at USGC-Alberta spread pricing we see a regular breakdown of the price relationship or “congestion pricing”. This is due to the fact that transient “sub-markets” can be form in a capitated transport system.
The question is using stochastic transport optimization (following similar method as reference 1 and 2) can we model and answer the following questions:
When there are documented disruptions in the transport system can we predict how large the congestion surcharge was and how did prices respond to the disruption?
Can we predict the occurrence of congestion by perturbing input factors in the system?
How does shape and connections in the transport network contribute to the propensity for frequency of the congestion and magnitude of congestion surcharge?
There is a fantastic work performed looking at US gasoline market that can be used as a guide and starting point to look at the Canadian crude oil transport network.
The majority of the data: (1) Pipe Tolls and Tariffs (2) Capacities (3) Supply and Demand factors are publicly available. (4) Pricing data and some of the historical flow data that is used for benchmarking and testing the models can be made available with some degree of modifications and can be anonymized.