Awesense
Building a Platform for Digital Energy
At Awesense, we’ve been building a platform for digital energy with the goal of allowing easy access to and use of electrical grid data in order to build a myriad of applications and use cases for the decarbonized grid of the future, which will need to include more and more distributed energy resources (DERs) such as rooftop solar, batteries as well as electric vehicles (EVs).
Awesense has built a sandbox environment populated with synthetic but realistic data and exposing APIs on top of which such applications can be built. As such, what we are looking for is to create a collection of prototype applications demonstrating the power of the platform.
The current challenge involves the analysis of the increasingly common Time-of-Use (ToU) electricity rates (tariffs) in order to predict (by means of simulation) their impact on the temporal shape of consumption load (peaks and valleys) and on utilities’ income.
Background
Traditionally, electricity consumers paid a flat rate per kWh. A clear usage pattern is emerging where electricity demand increases during the morning and afternoon hours (often referred to as peak hours) and decreases significantly during mid-day and at night (off-peak hours). Since utilities need to respond to the maximum electricity demand, they have to increase their capacity even though most of this capacity is not required during off-peak hours.
As the electricity demand continues to increase with the transition to EVs, electric stoves and electric heating, the demand will continue to increase. To reduce the need for more capacity, utilities have been introducing different rate plans that aim to shift some of the electricity usage from peak hours to off-peak hours. One such plan was recently introduced in Ontario, and its details can be found here. The high-level aim of this project is to evaluate the impact of such ToU plans on the example grid(s) in Awesense’s sandbox environment.
Details
Electrical distribution grids are composed of grid elements of various types (e.g. power lines, transformers, switches, meters, SCADA devices, etc.) connected to each other in a network (graph) structure. Certain grid elements like meters, SCADA devices, fixed or movable IoT sensors, and Distributed Energy Resources (DERs) produce time series data such as voltage, current, power, energy, battery state of charge, and other measurements.
In this project, the students will need to use our SQL API to retrieve the necessary time series and aggregate them to create a current load profile (for the whole grid or sections thereof). They will then have to make assumptions about the change in consumer behavior from the introduction of ToU rates (e.g. shifting some consumption to different hours) and simulate the impact from this on the overall consumption load profile. We are interested in multiple scenarios with different assumptions. If time permits, the students can evaluate the impact of such plans on the profitability of the grid by comparing the income with a flat rate to the income with ToU rate plans. Furthermore, optimization techniques can be applied to optimize consumption such that required capacity is minimized and profit is maximized.
Skillset
This work involves coding some analyses and visualizations on top of said data and APIs. It would require good data wrangling, statistics, data visualization and simulation skills to design and then implement the best way to transform, aggregate and visualize the data for the use case at hand. The data access APIs are in SQL form, so SQL querying skills would also be required. Beyond that, the tools and programming languages used to create the analyses and visualizations would be up to the students. Typical ones we have used include BI tools like Power BI or Tableau and notebooking applications like Jupyter or Zeppelin combined with programming languages like python or R.
Tool Access and Support
If the participants don’t have any electrical background, Awesense will teach enough of it to allow handling the given use case.
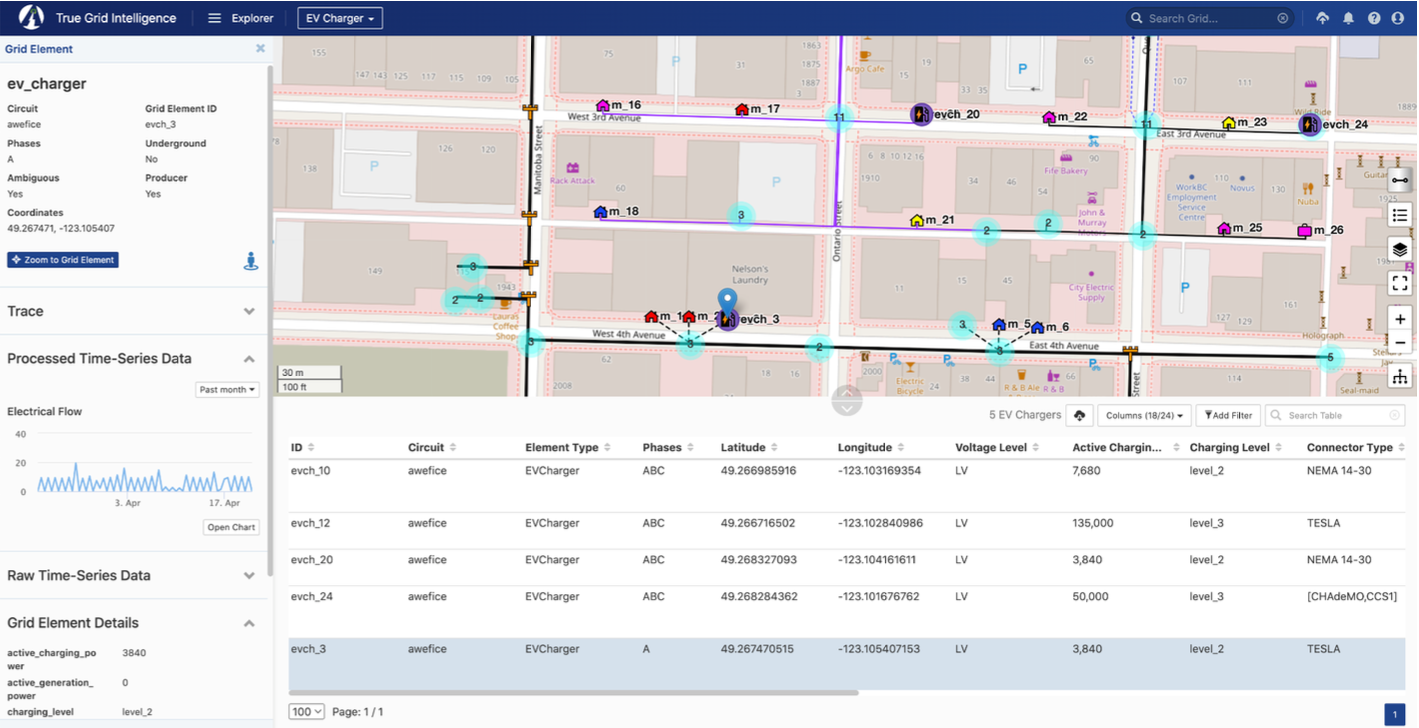
In addition to the previously mentioned SQL APIs, the Awesense platform also comes with a web-based application (graphical user interface front-end) called TGI (True Grid Intelligence) that serves as a companion visual explorer for the data stored in the platform. The snapshot below shows a portion of the grid available in the synthetic dataset. An EV Charger is selected (map blue marker and highlighted row in the table) and its properties shown in the left sidebar, along with an electrical flow time series chart. The SQL APIs include functionality for retrieving all this information programmatically.
For the duration of the project, upon agreeing to a standard end-user licensing agreement, participants in this PIMS project will be given access to the sandbox environment, including TGI, the programmatic SQL APIs and associated documentation, as well as access to a GitHub repo with sample SQL and python code snippets in Jupyter notebooks, showcasing how to use the APIs.
A successful project will consist of a set of visuals answering the questions posed above for the sandbox dataset, accompanied by any BI tool files or notebook code used to produce them; Awesense permits/encourages the public sharing of these artifacts, as long as credit for the dataset and APIs is given to Awesense (e.g. by including a “Powered by Awesense” phrase and an Awesense website link); publishing the raw data retrieved from the sandbox is not permitted.
Important note: project participants will be given individual access credentials, and they should not share with anyone else (including not among themselves) nor cache/save them in publicly posted files.