Awesense
The Energy Transition Platform
Awesense has built a sandbox environment populated with synthetic but realistic data and exposing APIs on top of which such applications can be built. As such, what we are looking for is to create a collection of prototype applications demonstrating the power of the platform.
The current challenge involves building computational techniques for automatically detecting the presence of behind-the-meter electric vehicles and disaggregating their consumption from the overall household (meter) consumption.
Background
Energy disaggregation, also known as appliance disaggregation is a technique which is used to analyze and break down the energy consumption in a building or household into individual appliance-level energy usages. The goal is to identify and monitor the energy consumption of specific “appliances” without the need for additional metering or sensors on each device.
The process of energy disaggregation involves analyzing the overall power signal from a building or household and applying advanced algorithms and machine learning techniques to separate and attribute energy consumption to specific sources. One of these sources can be electric vehicles (EVs), particularly ones plugged-in directly into regular outlets. These are the focus of the proposed project.
The ability to perform energy disaggregation analytics holds significant importance for utilities and electricity distribution. By gaining granular insights into customers’ energy usage at a more granular level, utilities can develop targeted demand response programs, optimize load distribution, and enhance grid management. Energy disaggregation analytics enables utilities to identify peak demand periods, forecast load patterns, and make informed decisions regarding infrastructure investments.
Details
Electrical distribution grids are composed of grid elements of various types (e.g. power lines, transformers, switches, meters, SCADA devices, etc.) connected to each other in a network (graph) structure. A feeder is a set of distribution lines (often operating at medium voltage) that collectively transport power from a substation to a multitude of downstream loads. Certain grid elements like meters, SCADA devices, fixed or movable IoT sensors, and Distributed Energy Resources (DERs) produce time series data such as voltage, current, power, energy, battery state of charge, and other measurements.
In this project, the students will need to use the Awesense SQL or REST APIs to retrieve the necessary time series and grid structure information to determine (and visualize) which households (meters) likely have an electric vehicle, at what times is it plugged in and how much energy does it draw.
Additional information about the EV disaggregation use case can be found here.
Skillset
This work involves coding some analyses and visualizations on top of the data and APIs described above and devising an algorithm for the redistribution of load to optimize overall capacity. It would require good data wrangling, statistics and data visualization skills to design and then implement the best way to transform, aggregate and visualize the data, and good mathematical/algorithmic skills for the optimization piece. The data access APIs are in SQL form, so SQL querying skills would also be desirable. Alternatively, REST APIs can be made available. Beyond that, the tools and programming languages used to create the analyses, visualizations and algorithms would be up to the students. Typical ones we have used include BI tools like Power BI or Tableau and notebooking applications like Jupyter or Zeppelin combined with programming languages like Python or R.
Tool Access and Support
If the participants don’t have any electrical background, Awesense will teach enough of it to allow handling the given use case.
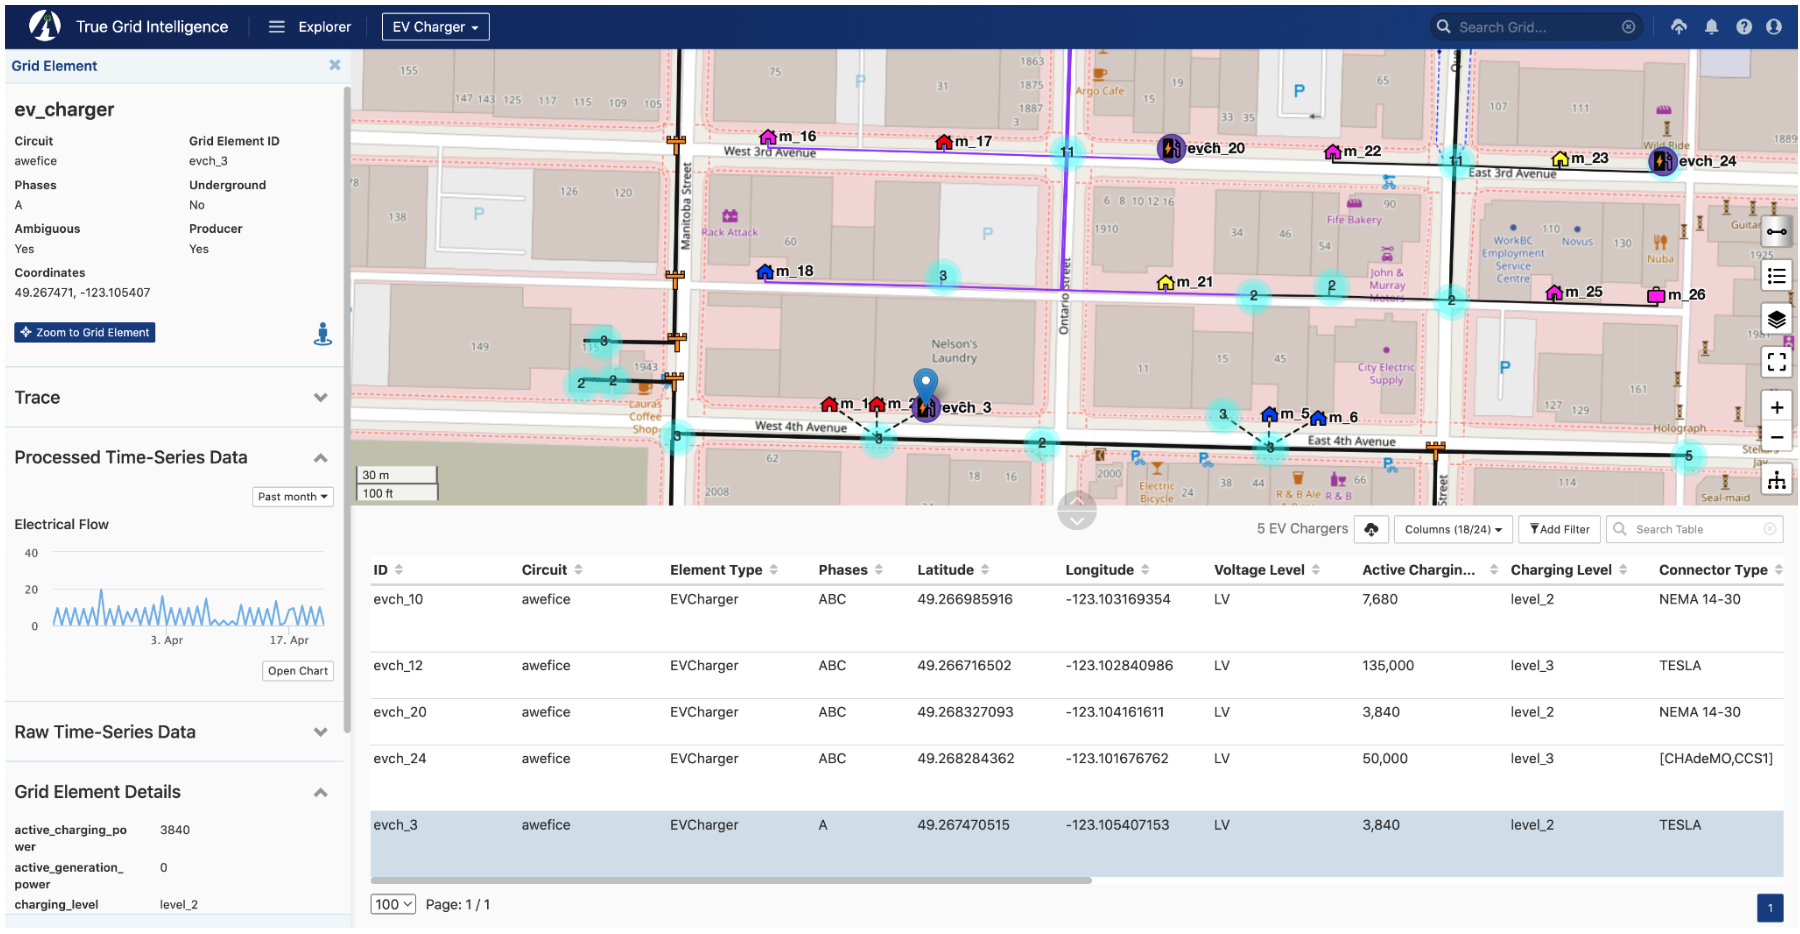
In addition to the previously mentioned SQL and REST APIs, the Awesense platform also comes with a web-based application (graphical user interface front-end) called TGI (True Grid Intelligence) that serves as a companion visual explorer for the data stored in the platform. The snapshot below shows a portion of the grid available in the synthetic dataset. An EV Charger is selected (map blue marker and highlighted row in the table) and its properties are shown in the left sidebar, along with an electrical flow time series chart. The SQL & REST APIs include functionality for retrieving all this information programmatically.
For the duration of the project, upon agreeing to a standard end-user licensing agreement, participants in this PIMS project will be given access to the sandbox environment, including TGI, the programmatic SQL and REST APIs and associated documentation, as well as access to a GitHub repository with sample SQL, REST and python code snippets in Jupyter notebooks, showcasing how to use the APIs.
A successful project will consist of an algorithm and a set of visuals answering the questions posed above for the sandbox dataset, accompanied by any BI tool files or notebook code used to produce them; Awesense permits and encourages the public sharing of these artifacts, as long as credit for the dataset and APIs is given to Awesense (e.g. by including a “Powered by Awesense” phrase and an Awesense website link; publishing the raw data retrieved from the sandbox is not permitted.
Important note : project participants will be given individual access credentials, and they should not share with anyone else (including not among themselves) nor cache/save them in publicly posted files.